
Recurrent neural networks
28 January 2022
The essence and importance of collateral inventory and its implications with demand forecast errors
3 March 2022
Recurrent neural networks
28 January 2022The essence and importance of collateral inventory and its implications with demand forecast errors
3 March 2022Prediction intervals as quantification of predictions using a neural network
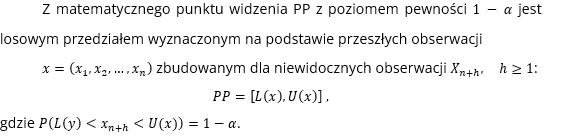
Prediction intervals (PPs) offer a convenient way to quantify forecast uncertainty, so they have been widely used in forecasting practice. PPs can provide information about best- and worst-case scenarios, enabling decision-makers to make informed decisions based on valuable information about the inevitable uncertainty of the future, as well as to make appropriate contingency plans. For example, narrow PPs signify a low level of prediction uncertainty, thereby building the decision-maker’s confidence in the predictions used in the decision-making process, while wider PPs may discourage high-risk decisions. In general, the quality of PPs is assessed in terms of their breadth and coverage in historical data. A reliable, high-quality PP would combine high coverage of future observations with a small – and thus informative – interval width.
Neural networks are not based on a well-defined stochastic model, so it is not easy to determine PP for the resulting predictions. Nevertheless, it is possible, and among the most commonly used methods that can be used to determine forecast uncertainty for nonlinear machine learning models are:
- Delta method (Delta Method) from the field of nonlinear regression,
- Bayesian Method,
- Mean-Variance Estimation Method using estimated statistics (Mean-Variance Estimation Method),
- metoda bootstrapowa (Bootstrap Method)
The traditional approaches mentioned above first generate point forecasts and then construct PPs according to certain assumptions about the data or noise distribution (e.g., independent variables with identical distributions, Gaussian noise, constant noise variance). Such restrictive assumptions often fail in real-world applications, resulting in PPs that may have low coverage for the test data set or overly conservative limits.
A number of error-related measures, such as mean absolute percentage error (MAPE) and mean square error (MSE), have been proposed in the literature for evaluating point forecasts. Of course, it is not possible to evaluate PP in this way. A review of the literature indicates that researchers’ efforts mainly focus on the design of PPs, without objectively assessing their quality in terms of length and probability of coverage.
The delta method is based on the interpretation of a neural network as a nonlinear regression model. This allows the use of the standard asymptotic approach for PP construction. Suppose that given a network ƒ :
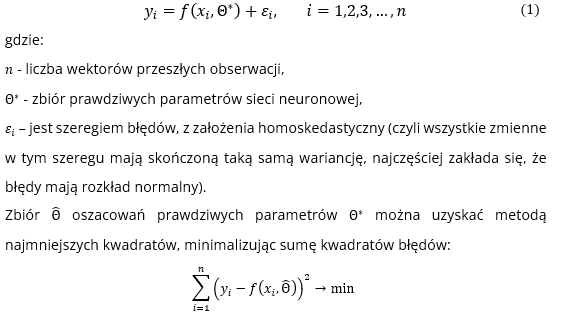
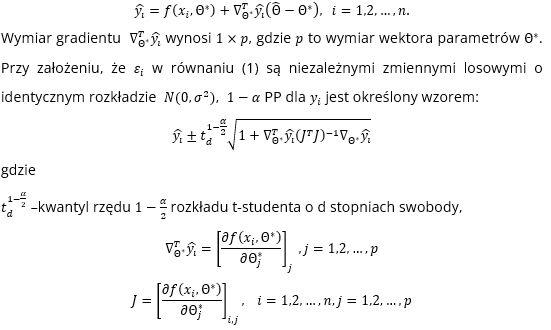
The Taylor expansion of the first-order first function (1) around the true values of the model parameters Θ* can be written:
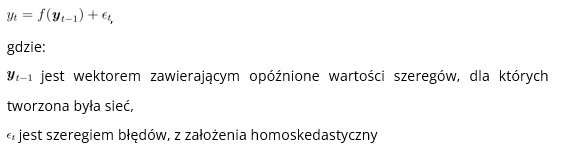
In the bootstrap method, future sample paths are generated using residuals obtained by the bootstrap or simulation method [Hyndman & Athanasopoulos, 2018].
Let a neural network f fitted to the data be given:
(That is, all the variables in the series have a finite equal variance, most often the errors are assumed to have a normal distribution).
One can iteratively simulate future paths resulting from this model, either by randomly generating a value for ε, from some assumed distribution, or by resampling from historical values.
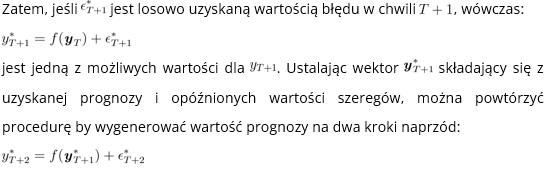
In this way, a random path of future values of the forecasted series can be iteratively obtained. By repeatedly simulating sample paths, we build knowledge of the distribution of all future values based on the matched neural network. If we do this several hundred or thousands of times, we can get a good picture of forecast distributions. Unfortunately, this approach is resource- and time-consuming. In addition, it requires an assumption about the distribution of errors.
In addition to the above methods, empirical approaches can also be used. Note that after the neural network has been running for some time, we no longer have not only the history of the true realizations of the time series, but also the history of the predictions obtained from the model (in this case, the neural network). Thus, we can obtain the true model errors (residuals) and estimate prediction intervals based on this (e.g., by determining the standard deviation of the residuals and building a prediction interval around the prediction using the 2 or 3 sigm rule).
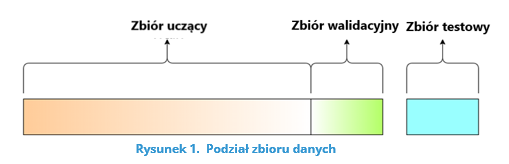
Obviously, this method has the problem of the so-called “problem”. “cold start”, that is, we do not have the possibility to use it at the beginning of the system operation. Note, however, that we can use the standard approach associated with splitting a dataset into parts in this situation (Ripley (1996) – Figure 1):
- learning set (about 70% of the data) – on its basis we determine the parameters of the model,
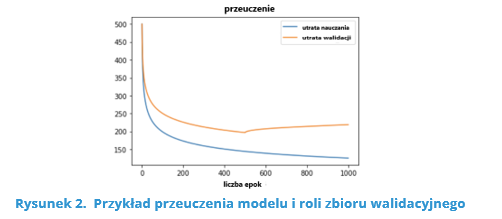
- validation set (about 20% of the data) – on its basis we tune the hyperparameters of the model (e.g., the number of neurons in the hidden layers of the neural network), which is supposed to prevent over-learning of the model (Figure 2),
- test set (about 10% of the data) – on its basis we check the quality of the model fully learned model.
Source : https://towardsdatascience.com/train-validation-and-test-sets-72cb40cba9e7 (28.04.2021)
Source : https://blog.roboflow.com/train-test-split/ (28.04.2021)
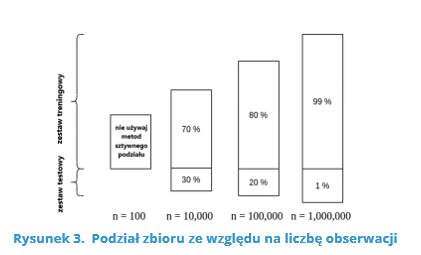
The percentages given are quite approximate and largely depend on the total number of observations (Figure 3).
Source: https://www.baeldung.com/cs/train-test-datasets-ratio (28.04.2021)
Note that in this situation we can use the grades obtained on the test set. Just compare them with the real values that have been observed. This allows us to determine the residuals of the model and, in a further step, estimate the standard deviation of the residuals, and thus construct a prediction interval using the standard deviation estimated in this way, and this we can use to determine the error of the predictions in classical terms discussed in the previous article.
Literature sources:
- Hyndman, R. J., & Athanasopoulos, G. (2018). Forecasting: Principles and Practice. (2nd ed.) OTexts. https://otexts.org/fpp2/
- Ripley, Brian D. (1996). Pattern Recognition and Neural Networks. Cambridge University Press.
- https://towardsdatascience.com/train-validation-and-test-sets-72cb40cba9e7 (28.04.2021)
- https://blog.roboflow.com/train-test-split/ (28.04.2021)
- https://www.baeldung.com/cs/train-test-datasets-ratio (28.04.2021)
This article was written thanks to the funds from the European Union’s co-financing of the Operational Program Intelligent Development 2014-2020, a project implemented under the competition of the National Center for Research and Development: under the “Fast Track” competition for micro, small and medium-sized entrepreneurs – competition for projects from less developed regions under Measure 1.1: R&D projects of enterprises Sub-measure 1.1.1 Industrial research and development work carried out by enterprises. Project title: “Developing software to improve forecast accuracy and inventory optimization from the perspective of customer and supplier collaborating in the supply chain using fuzzy deep neural networks.

Related entries

How about AI: what is it and how does artificial intelligence work?
Artificial intelligence (AI) is the ability of machines to exhibit human skills such as learning, inference and recommending solutions. Artificial intelligence enables associations to be made […]

The essence of the classic model of inventory renewal based on the information level – the point of reordering
The main feature of the model based on the so-called. “ordering point,” also known as an information-level ordering system or continuous review [3], is a condition […]

Fuzzy systems
Based on fuzzy sets, a fuzzy inference system can be built. In such a system, fuzzy rules are implemented for modeling, which in turn make it possible to carry out the process of fuzzy inference.